Essential insights into the hidden costs of market data

You pay for market data, but who actually uses it?
We all know the feeling. You’re scrolling through your banking app and spot a charge for a gym membership you haven’t used in months. Or a charge for a streaming service you signed up for to watch one series that ended long ago. These are the kinds of costs that are easy to overlook, but once you notice them, you can do something about it. Cancel the subscription, make a mental note to finally go back to the gym.
Now imagine those same kinds of costs, but hidden from view. Not a few incidental charges, but significant amounts tied to something as technical and complex as market data. Financial institutions spend serious money every month on data feeds from vendors. These costs are based on what data vendors deliver, but inside the organisation, the real question is this: how much of that data is actually being used?
What comes in from data vendors is one thing. What internal systems and applications actually use is often something else entirely. And that difference isn’t just a technical detail. It has a direct impact on cost control, data vendor contracts and your ability to allocate expenses fairly within the organisation.
And just like with your unused gym membership, you can only take action once you know what you’re paying for. That’s what this article is about: uncovering the hidden costs of market data. In the BIQH Market Data Platform, you have visibility into both sides of this flow: retrieval statistics and usage statistics.
Usage vs retrieval: two sides of the same market data flow
To understand market data costs you need to look at both what enters your organisation and what is consumed internally. These are two distinct flows.
Retrieval statistics: what comes in from the data vendors
Retrieval statistics track the data delivered to your organisation by data vendors. They show exactly how many instruments or data fields have entered your platform and serve as the first checkpoint when verifying what has been invoiced. If a data vendor claims in their invoice to have delivered 1,000 instruments, retrieval statistics can confirm that figure.
More than just a control mechanism, they also provide data lineage. Retrieval statistics mark the starting point of every market data flow, showing what came in, when it arrived and in what format. This creates a clear link between the data you are billed for and the data that was actually delivered.
For example, if a data vendor delivers 1,000 instruments, retrieval statistics confirm that delivery. That figure should match exactly what appears on the invoice. In this way, retrieval statistics offer both operational transparency and financial control.
Usage statistics: insight into what your systems actually use
Usage statistics focus on the next step in the data flow: which internal systems and applications actually use the data. They record when data is requested, whether through an API call, a scheduled update or a manual query. This makes it possible to see what is being used, by whom and how often.
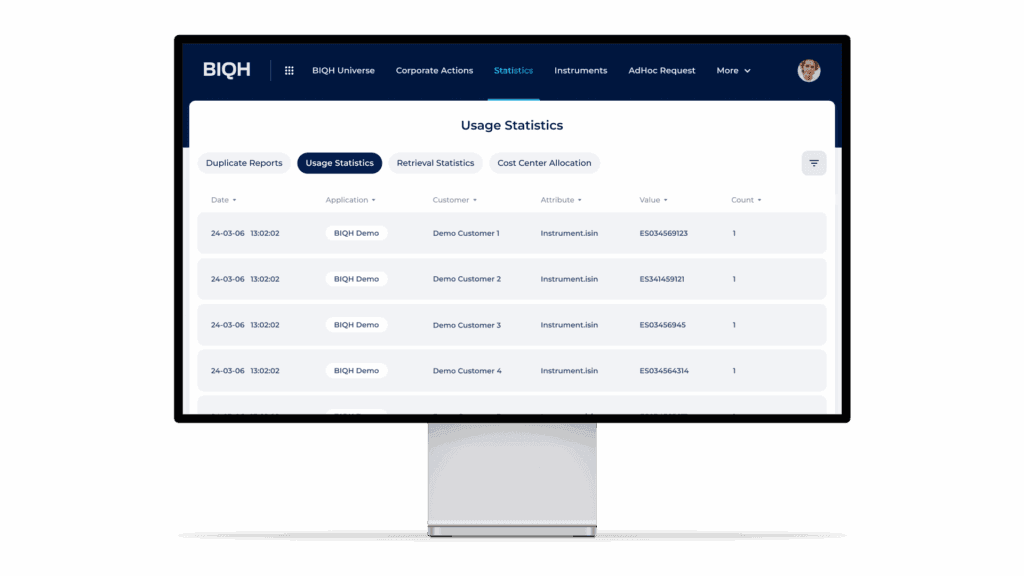
Usage can be analysed in different ways. One approach is to count by data field, such as the number of closing prices retrieved on a given day. Another is to count by value, showing which identifiers were used and how frequently. For example, one specific ISIN might be retrieved ten times and another ISIN retrieved five times, resulting in fifteen closing prices consumed. This level of detail reveals both the volume and the content of internal usage.
This insight is essential for cost allocation, as it shows exactly which teams or systems use which parts of the market data. It also plays a key role during audits, where you may need to demonstrate to data vendors that the data was actually consumed by the end applications entitled to use it.
The retrieval – usage gap
By placing retrieval and usage statistics side by side, you can identify the retrieval – usage gap: the difference between what is delivered and what is actually used. This is where hidden costs often arise.
Suppose a data vendor delivers 1,000 instruments, but only 600 are used internally. That leaves 400 instruments that are paid for but never accessed. Without visibility into this gap, the unused portion of your data remains invisible, and there is little incentive to address it.
Seeing the gap is the first step. Closing it means cutting costs and regaining control over your data flows.
Why this matters: three practical reasons
There are three concrete reasons why every market data manager needs visibility into both retrieval and usage. The first is invoice validation. Data vendors charge based on what they deliver, regardless of the question whether the data was actually used. Retrieval statistics give you a way to check whether the invoiced volume matches the market data that was received. Just as importantly, they establish clear lineage by marking exactly what entered the organisation, when it arrived and in what format. Without this, there’s no way to verify if you’re paying for something that never arrived.
The second reason is cost allocation. The invoice from a data vendor is often a single amount, even though the market data is used across different systems and teams. Usage statistics show exactly who consumed what, making it possible to distribute those costs fairly within the organisation. Instead of relying on assumptions or rough estimates, you can base internal recharging on real usage.
The third reason is to uncover and address the retrieval – usage gap. Market data that goes unused still incurs the same cost as data that’s consumed. By comparing retrieval with actual usage, you can see where money is being spent without return. This provides a starting point for smarter decision-making and more efficient market data management.
A foundation for cost centre allocation
Retrieval and usage statistics are more than reporting tools. Together, they form the foundation for allocating market data costs across the organisation. Retrieval statistics confirm what was delivered by the data vendor and match it to the invoice. Usage statistics then show how that same data is used internally, identifying which systems, teams or applications made use of it.
The combination creates a clear and traceable flow from external delivery to internal consumption. This is the essence of market data lineage. With both sides in view, you gain the insight needed to divide costs not by assumption or headcount, but by actual usage.
Instead of seeing the data vendor’s invoice as a single line item, you can treat market data as a shared resource and assign responsibility for its use to where it truly belongs.
Conclusion: you can only manage what you can see
Without a clear view of what enters your organisation, what is actually being used, and what remains untouched, you cannot make informed decisions about cost allocation or future changes in market data consumption. Costs are accepted without question, usage goes unmonitored, and internal distribution becomes guesswork. Market data is too expensive and too important to be navigated blindly. With retriever and usage statistics in place, you finally gain the transparency needed to take control, not only of your spending but also of your entire market data landscape.
Retrieval and usage statistics bring visibility to the hidden side of market data. They give you oversight of data vendor spend, enable fair cost allocation, and expose the retrieval – usage gap. Most importantly, they strengthen your market data lineage by linking external delivery to internal use.
The first step towards better market data management is simple: make the invisible visible. Ready to uncover your own usage gap? Or would you like to discuss this topic with us? Visit our contact page or download the factsheet.